
10 Stocks to Avoid
Jan 20, 2023We have something a little different for you today.
Rather than telling you a hot stock to buy, we’re going to do the complete opposite. We’re going to talk about the stocks to avoid.
Avoidance should be simple enough, in practice. But after you view our list, you might find that the art of avoiding bad stocks can be just as tricky as the art of finding good ones.
So let’s get started!
Explanation: The Hot Pans
Why come up with a list like this? Let’s rewind the clock back a bit. When you were a kid and you touched a hot pan on the stove, it only took a split second to learn a valuable lesson.
Hot pan on the stove = bad.
As a toddler, basic avoidance like that is easy to pick up. But the world of investing and picking stocks isn’t so obvious. It may be months, even years, before you realize when you’ve picked up the wrong pan—er, stock.
Our list today isn’t about picking the right stocks. It’s about avoiding the wrong ones. Above, you saw a list of stocks that we think may be flying too high and we’ll explain why we think that in a little bit.
But if you own one of these stocks, try to think back to that hot pan on the stove. Try to remember the simple lesson you learned as a kid.
If something is wrong, get away from it.
While some of these stocks may be great buys in the long term, we sense there’s too much heat on the stove. They’re flying a little too high for our liking. And like Icarus floating too close to the sun, that can mean overheating.
And as we all learned as kids…avoid the hot pan on the stove.
Method: How We Figured It Out
Okay, maybe the above needs a teensy bit more explanation than “hot pan = bad.” So without further ado, here’s the methodology we used to analyze these stocks and come to these conclusions.
We started with the members of the Russell 1000 index. This gave us a broad spectrum of large-to-mid-cap U.S. equities.
Next up? Finding out who’s overvalued. We took a three-pronged approach to find these names.
1) Technicals
We have a few common technical indicators that point us in the right direction. These include the Relative Strength Index (RSI) and Stochastic Oscillator to help determine if a stock is overvalued.
If RSI is over 70? That’s an “overbought” signal. If the Stochastic Oscillator goes above 80? Overbought.
Of course, each indicator alone can be hit-or-miss. But use them together and you start to sense a stronger signal from the technical data.
Technical indicators are generally a less persistent measure of over-valuation, as they can change their signal (Sell to Buy) over short periods of time relative to Fundamental measures (see more on this below).
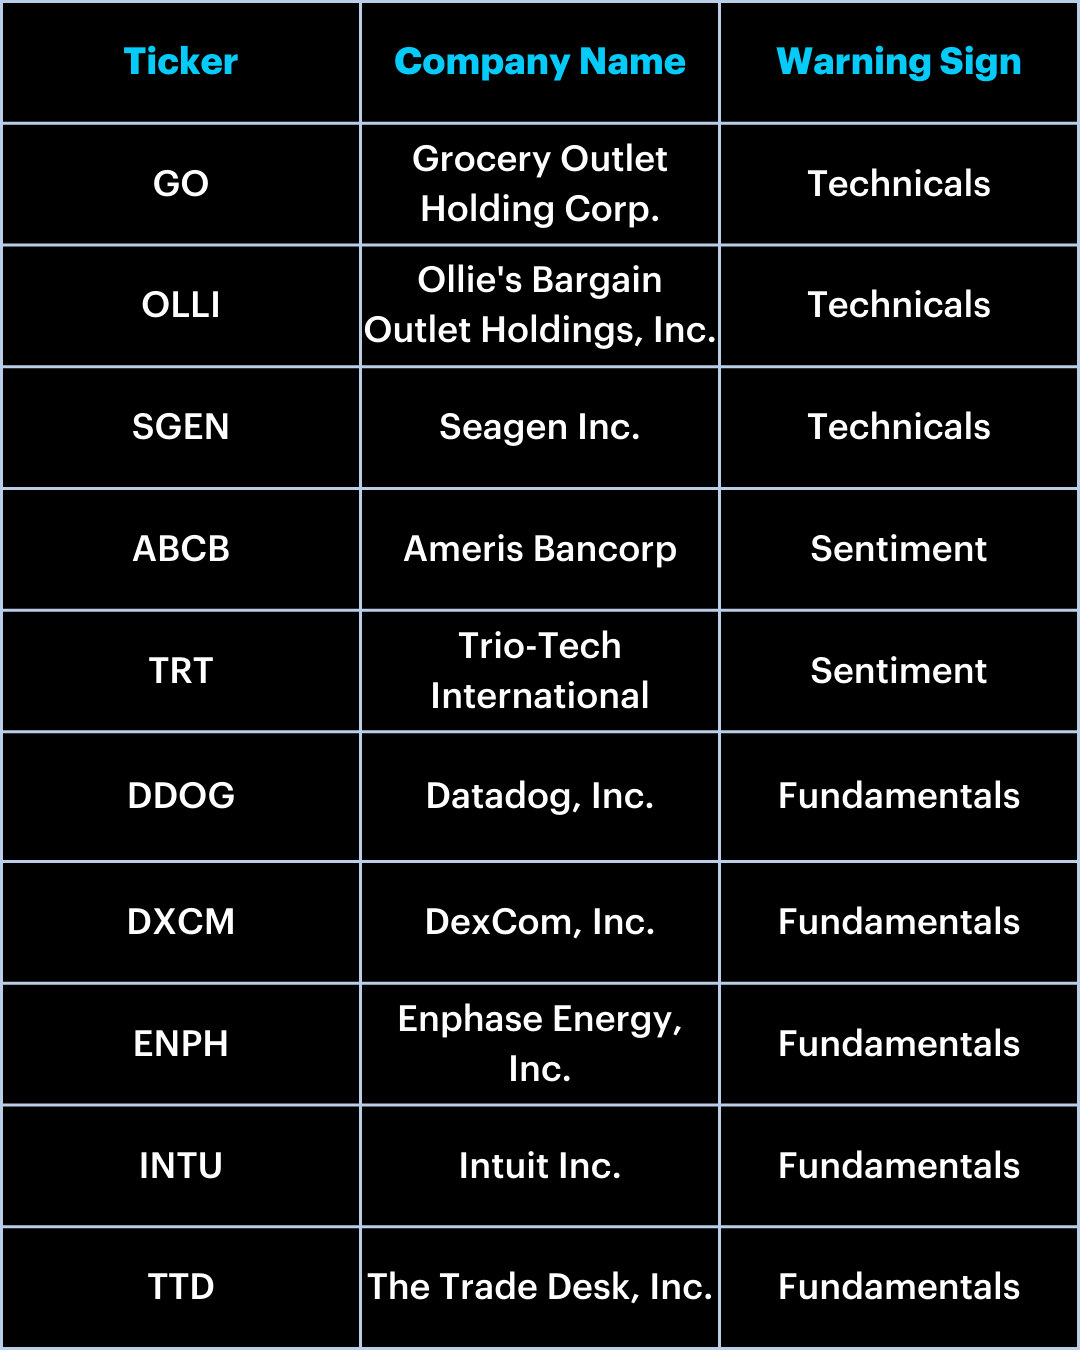
TL;DR: The Names of the Stocks to Avoid:
Here are the stocks we don’t like because they’re possibly flying too high 👇
2) Sentiment
Sentiment is the least potent indicator of the bunch as to whether a stock is overbought, true.
But a significant change in sentiment can be a big deal. It can even spell doom for even the most beloved businesses.
Think of it like a barometer dropping. In the world of weather, a sudden drop in barometric pressure is a big deal. So it is with sentiment too. A big drop means something.
The question is, how do you find when sentiment drops suddenly? And what if a stock goes from generally positive to decidedly negative?
Here’s our trick: we use a sentiment score based on Twitter data. To get the sentiment of a stock, AI (artificial intelligence) scores the tweets related to a company. Negative? Positive? AI helps figure it out.
Then, with the data aggregated into a daily score, we have our “barometer.” We can track big changes from positive to negative.
A reversal in sentiment may not cut the stock price in half, true. But it’s certainly another metric against a stock’s chances.
3) Fundamentals
Last but not least is looking at a company's fundamentals. So we started with the most basic question: Is the company valued appropriately?
A company’s fundamental valuation ratio is one of the strongest signals when a company is over-valued. But what is a “fundamental valuation ratio”?
We used the following metrics:
-
Price to Book: This is the company’s market cap to its “book value,” or, as some might put it, the net asset value of a company.
-
Price to Cashflow: Cash is king, after all. The ratio of price to cash flow helps establish how much the price action on a stock is due to hype and perceived future value—and not necessarily money flowing in.
-
Price to Earnings: You know how important earnings are—a stock can rise or fall when a company misses or beats earnings expectations.
-
Price to Earnings to Growth: A bit complicated, so bear with us. Also known as PEG, the Price-Earnings-Growth ratio builds on the famous P/E ratio (price to earnings) by calculating expected earnings growth in addition to pure earnings. This helps provide a more forward-thinking look at a company’s underlying value.
-
Price to Sales: This is a direct comparison between the stock price and the revenues that drive a company.
-
Enterprise Value Multiple: Although a practice often associated with private companies, enterprise value multiples are a handy rule of thumb for the basic value of a company—and whether the stock price is venturing too far.
-
Price to Fair Value: With fair value representing the assets and liabilities of subsidiary companies, this helps us gauge whether what the parent company owns is really worth the price.
If any stock showed up in the top 5% most expensive stocks for each metric, we see a “hot pan” out there.
For example, let’s take the Price to Earnings ratio. We looked at this ratio for each stock in the Russell 1000. Then we included each of the top 5% stocks here in our list before running the same analysis with each of the other metrics.
Fundamentals are the stickiest measures of a stock being over-valued, as reported Earnings and Sales don't change from day to day.
Disclaimer: When Stocks Might Survive
Let’s be clear: we’re not saying the companies on our list are doomed to failure and bankruptcy.
We’ve used a multi-faceted approach to find over-valued names. Our approach—to stack methods until we get a more accurate picture—is sound. But nobody has a crystal ball.
A stock can be too expensive…and still, remain too expensive for a while.
Some stocks stay overvalued for a very long time. This is especially true for stocks that are in the middle of a historic run. Investors who get FOMO (fear of missing out) can pile more money into the stock, further overheating it—and hiding its fundamental issues.
Overall, we rate these companies as currently overvalued. That means they’re running the risk of a pricing correction, in our view. But it doesn’t mean we view a pricing correction as inevitable right now -- but rather viewed as due for a change at some point in the near future.
Even so, it’s possible to look at a hot stove and see the signs—stove turned on, oil in the pan smoking—and know that you shouldn’t touch the pan.
If you hold any of the stocks above, it might be time for a good hard look at whether you want to stay in those stocks.
