

Top 3 Ways To Trade Around The Crypto Bear Market
May 17, 2022We’re back! And what we tell you today is going to make your day. Because today, we’re updating you on our Technical Indicator Crypto Picks.
If you recall our previous introduction to the concept, Technical Indicators are predictive cues we see in the markets. These cues highlight potential short-term trade opportunities.
They’re not crystal balls, true. But when you use multiple Technical Indicators together, they can make a compelling case for where an asset is heading.
Below, we’re going to be throwing some charts at you. (Note: Don’t be intimidated. We’ll explain what each one means along the way.)
Fortunately, we’ve got all the analysis you need right here. What’s our analysis telling us? Right now, yes, markets are stormy. There are risks everywhere. And those risks certainly exist in the crypto markets.
But with risks come potential rewards. Especially if we can find opportunities where cryptocurrencies are oversold.
Ready for the technical analysis? Apply our proprietary technical indicator screens and find out our favorite crypto investment opportunities. See below for the juicy details 👇
Our Picks:
1) LEO

LEO is flirting with “oversold” territory, given its RSI is hovering just below 40. (Note: RSI? Yes, this is the “Relative Strength Index, and the lower it goes, the more we believe an asset may be oversold).
That number isn’t perfectly certain yet, and we don’t want to be pre-emptive.
So we’re entering this trade cautiously, adding to our bet once the RSI falls to 30 or below.
You’ll notice the purple line above, using the right-hand side scale. That’s RSI, and it’s been dipping.
It’s a fairly simple indicator: below 30, we see it as a signal that the price is too low, and the asset is oversold. We think this means it’s more likely to bounce back up. When the RSI goes over 50, we see it as a bullish sign. It indicates the price has risen from oversold territory and back to a positive trend.
On this chart, we also have an ADX (Average Directional Index), which measures the strength of an up-or-down trend.
At 25, the ADX is fairly low—reflecting a fairly stagnant trend. If it was even lower, we’d be even more confident that the trend is weak. Add a negative (weak trend) to a negative (a downward trend) and you have the recipe for a positive: a trend ready to reverse.
But we’re not quite there yet, according to our Technical Indicators. We’re just headed there. While the current price (blue) is below its 30-day Moving Average (orange; this is the trend of the price over the previous 30 days), we think movement above this line is a solid indication of a positive trend.
If you want a safer bet, you can wait until the price moves above its 30-day moving average (blue goes above orange). However, you'll be missing out on the potential gains that happen from now until then.
Hey, it’s the future we’re trying to predict here. No one on Planet Earth can’t be 100% certain.
But with these indicators in our back pocket, we can have confidence that LEO is leveling out before its March upward.
2) MKR
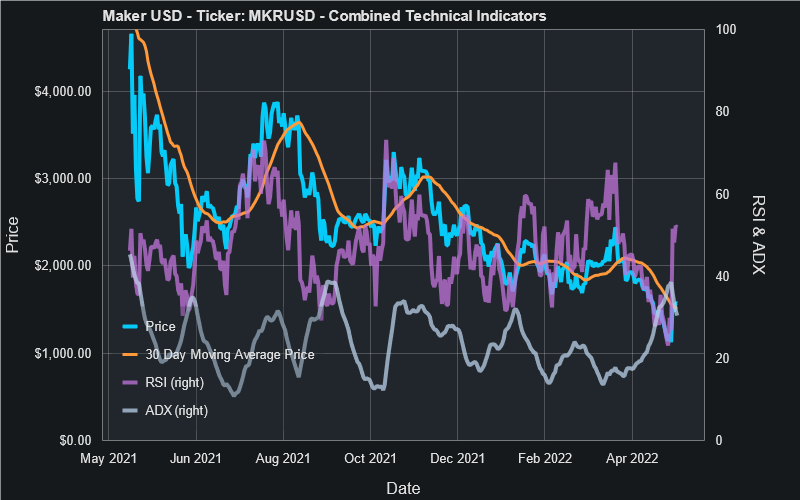
Maker (MKR) does us a favor: it’s a little clearer than LEO. Yes, it’s oversold, but at least we’re more confident that it’s oversold. And this gives us options.
Granted, the overall trend of MKR is not too attractive. But we’re looking for shorter-term signals that could help us sniff out where it may be about to move.
Let’s look at the RSI (purple line, using the scale on the righthand side) in the chart above. You’ll notice it recently crossed from below 50 to above 50. The indication? It’s reversing its downward trend.
Overall context? This puts MKR at a still-attractive price while its technical backdrop strengthens. We’d like to see an ADX below 25 to confirm the stalled downward trend.
As for conclusions: while you can wait for that ADX signal, this may be a short-lived bounce back up ripe for the taking. So best not to hesitate, and watch it diligently.
3) TRX
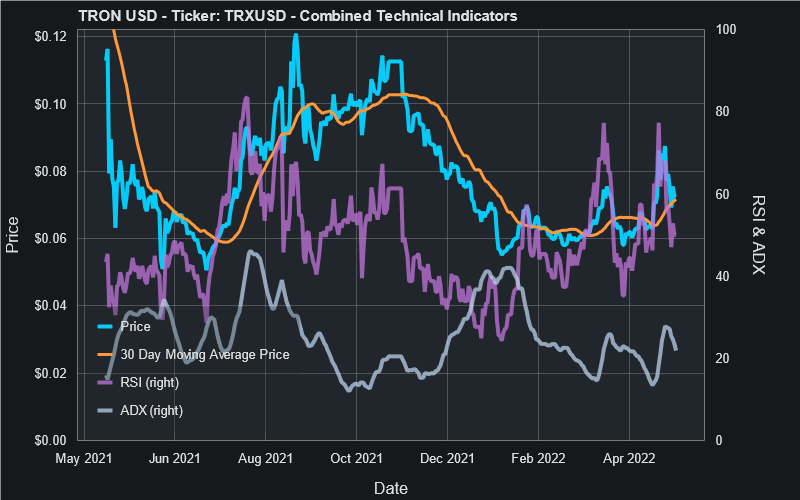
Last, but not least, we have TRON (TRX). In fact, this is our favorite of the three we've covered today.
To recap: TRON was recently overbought. Like a pan that was on the heat too long, we recommend caution before you go touching the handle again.
Even so, that doesn’t mean there are no opportunities. Check out the RSI—purple line using the right-hand side scale. It was above 70 recently, indicating overbought. Not surprisingly, it’s been on a small drawdown since then.
Now let’s look at the 30-day Moving Average, the orange line. We’ll watch this one cautiously, checking to see if the level holds.
Our expectation? The price may bounce back up and continue on a longer-term trend.
This is a good time to remind you about levels of support—the price point where we expect the current price to move towards if it starts to drop. (Note: during shorter time-frames, an asset is under no obligation to seek its level of support).
With many assets, a price decline may shoot it hurling back towards its 30-Day Moving Average, but it’s unlikely to go far below that.
We recommend this as a buy, but if you’re more cautious, you might wait to confirm the bounce back up in price.
The risk with the cautious approach? You always risk losing out on the gains that happen in the meantime.
