

Are We Headed Towards A Recession?
May 24, 2022If checking the major stock indexes is the scariest part of your day, something’s wrong.
We know it’s tough out there. Every time you check the market, it seems to have gone another hundred points. Times are uncertain. War. Disease. Recession. The possibility of famine. And more.
Fortunately, there’s a way to find your footing even in times of extreme fear. It’s called knowledge of the Market Cycle.
The Market Cycle is your bird’s-eye view of the entire world of investing.
Without it, turbulence seems unpredictable. Unsteady. Headed for disaster.
But knowing where you are in the Market Cycle? It’s like that comforting kiosk at the mall that says: “YOU ARE HERE.”
The only problem?
Few investors understand the Market Cycle. And they don’t research it well enough to know when they can point at a cycle and, with a firm degree of confidence, that “I AM HERE.”
How would you like to change your fear of the daily stock market check into the least worrisome part of your day?
How would you like it if when markets went down, your heart rate remained down with it?
You can do it. You just need that mall kiosk. That roadmap that tells you where you are, and where you’re going.
Here’s how to find it.
Introduction: Understanding the Market Cycle
Market cycles are often described as two animals: bulls and bears.
-
A bear market is typically defined as a major stock index being down 20% from its top
-
A bull market is a market index that is up 20% from its bottom
That’s simple enough to understand. In a bear market, stocks are headed down to 20% or more. In a bull market, the opposite is happening. Bears bad, bulls good.
But does that give us an accurate picture of what it’s like to live through one of these? You don’t exactly see bears walking down the streets these days, do you?
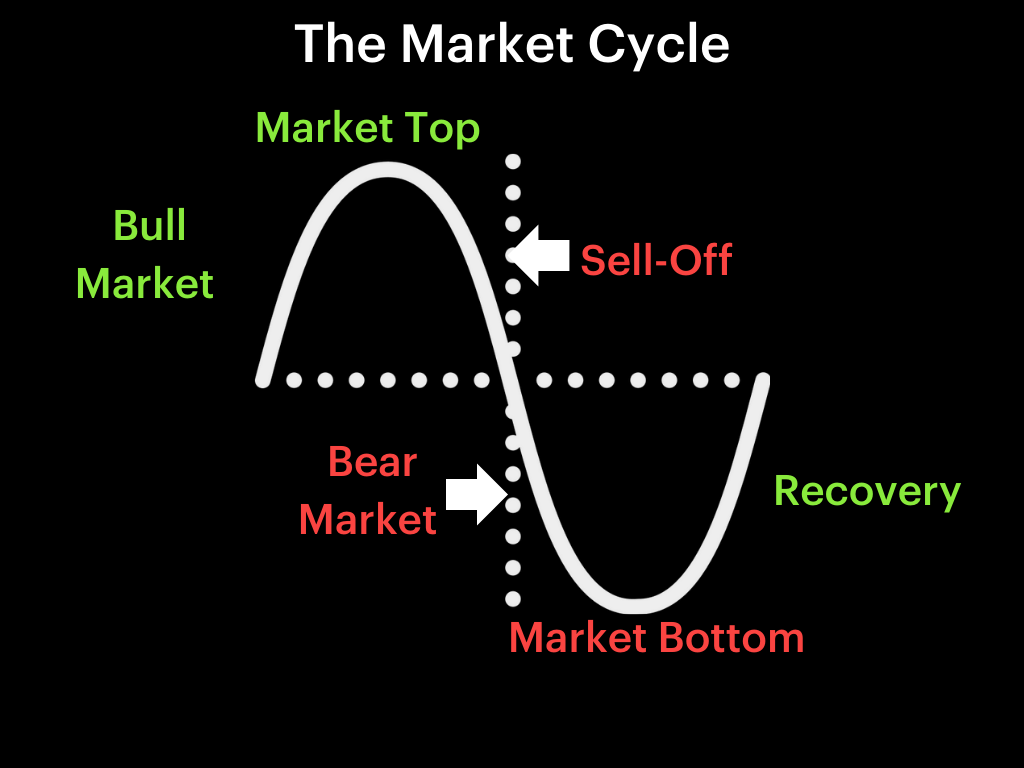
To clarify, we break the market cycle into 4 distinct quadrants.
-
Recovery, when a stock market rebounds from a previous bottom
-
Bull market, which is the 20% or more increase from that bottom, ending in a market top. Of course, we can only know the market top after it’s happened.
-
Sell-off. The bull market, at this point, has topped off and now may be teetering a bit. Stocks are beginning to sell-off, but there may be no indications of a bear market just yet.
-
Bear market. This is the new market bottom, with the bear market firmly decreasing 20% or more from its recent highs. Next stage: back to the first step, the recovery, to repeat the entire process again.
You can see the overall “wave-like” shape of the market cycles below:
Keep in mind that we won’t typically define bull markets as new market tops, but rather short-term tops in which the increase went 20% up or more.
Understanding Compounding Returns:
Remember: although they sound the same, gaining 20% and losing 20% on an investment aren’t equal. If you gain 20% on 100, it goes up 20. If you lose 20% of that 120, that percentage is greater than 20% of 100. You then lose 24 points down to 96, 4% lower than our starting value.
Why is this important in the context of market cycles?
Because you can have a full market cycle without reaching the all-time high again. That means if you time it wrong, you can stand to lose out on some serious value.
Example Cycle:
Let’s dip back into the past.
The S&P 500 underwent a pretty complete market cycle from 1957-1962. See the chart below. Here are the points we can see along the way:
-
After an initial recovery phase, we can mark a Bull Market from July 25, 1958 (20% gains! woohoo!) to its peak on December 12, 1961. Remember: it’s not just 20%. This bull market went up an additional 54%, providing a cumulative return total of 86% if you were in the market the entire time.
-
After the market peak, we enter a Sell-Off phase until May 28th of 1962. Let that sink in. It took 6 full months to cross the 20% barrier from the cycle top, at which point it transitioned from a Sell-Off to a full-blown Bear Market. At this point, your cumulative return from the previous market bottom is still 42%. Not bad.
-
We then reach the bottom of the Bear Market on June 26th, covering an additional 6% in losses. Overall? From one cycle bottom to the next, you’ve returned about 34%.

History of Drawdowns:
In market terms, a drawdown is a peak-to-bottom decrease.
For example, let’s say you own a stock worth $10,000. It then draws down to $8,000 before beginning a new climb to $11,000. That total “drawdown” was 20% of the $10,000, or $2,000.
Some people also use the phrase “max drawdown” to talk about the total losses if you sold at the lowest point in the cycle. In the above case, that would solidify your losses of $2,000—but only if you sold at $8,000.
Why bother looking at max drawdowns in the S&P 500’s history? Simple. To figure out how bad this current drawdown can get before it takes a turn back upward.
Don’t fear the drawdown. Understand the drawdown.
For starters, realize that we’ve been here before. Below, let’s look at a history of drawdowns from all-time highs in the S&P 500. This isn’t too difficult. We can visually identify exactly where the lowest points were. You may even remember some of these scary drawdowns: low points in the early 80s, the bursting of the tech bubble in 2001/2002, and the Great Financial Crisis of 2008/2009.

Where’s our current drawdown? It shows up as a blip, but it’s not historic quite yet.
When we look at the times the max drawdown was lower than 20%, we realize the max drawdown is usually about 30%.
And those were in systematic meltdowns, like the bursting of the tech bubble and a full-blown financial crisis. Therefore, we have some confidence that this current drawdown is unlikely to hit 45%.

Of course, this is taking a greater history into account. What about more recent drawdowns, say, in the 21st century alone?
Let’s look at market cycles over the past 20 years and see how much they typically lose beyond the first 20% of a bear market:
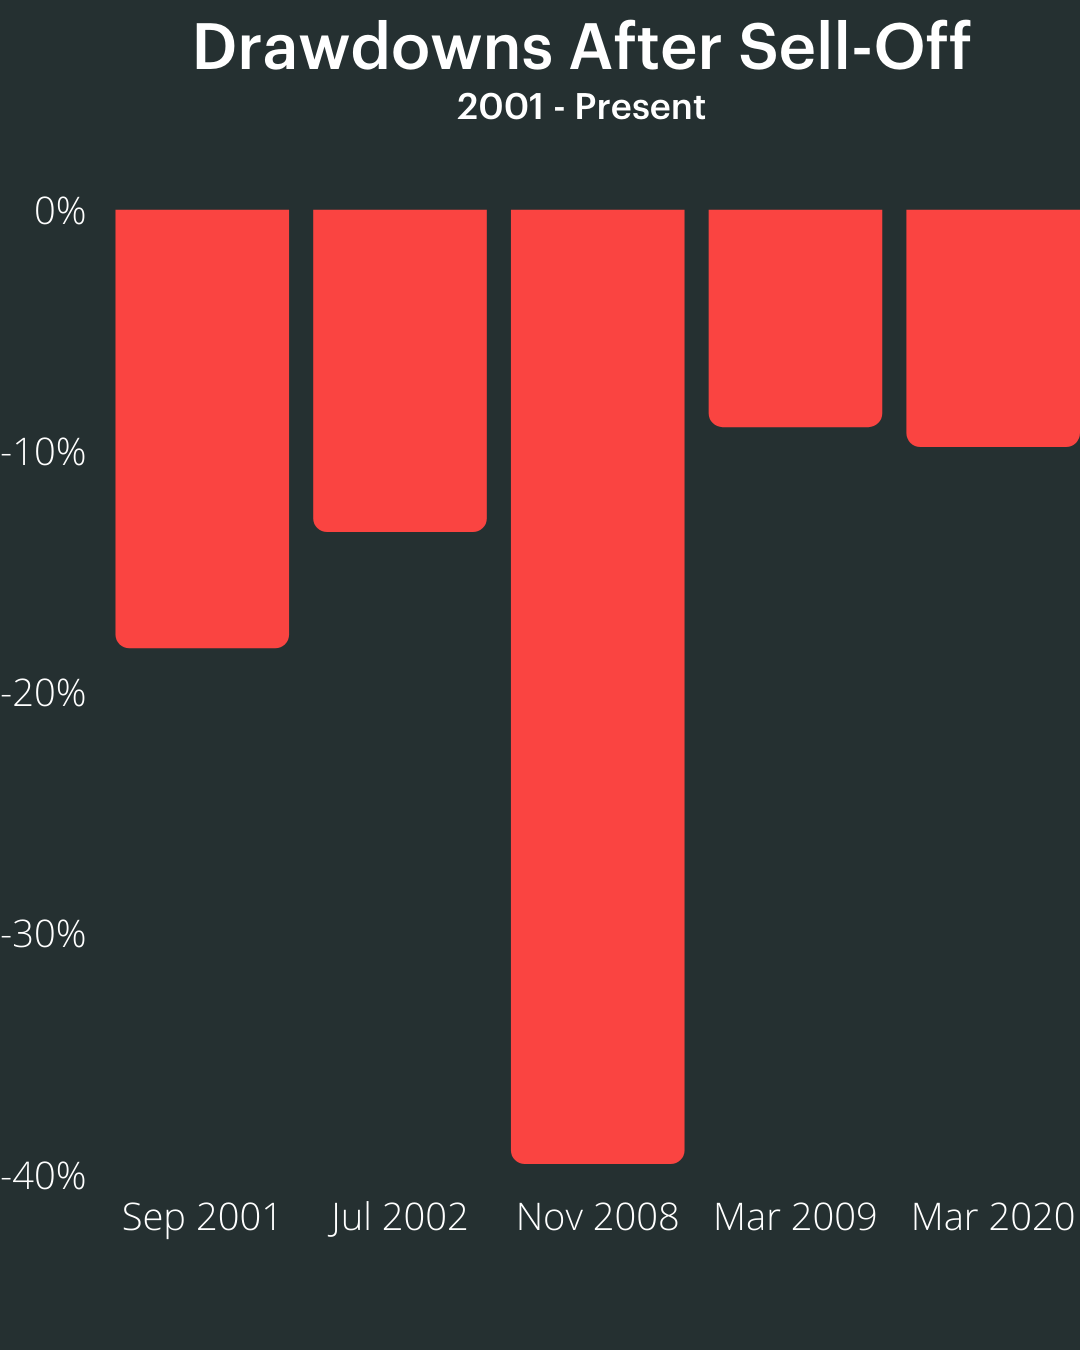
On average, that gives us 13% beyond the first 20% loss of a bear market.
Where are we right now? On the precipice of 20% loss from the last market cycle top. We’re nearing bear market territory. This is a critical time to examine.
To break it down, we’re including a chart below. This breaks down broad sector performance during periods of drawdown. This gives us a “compass” of our stock selection.
In the table below, we’re looking at what happens to stock sectors after the 20% drawdown. This shows two types of returns:
-
Absolute return, the simple return of investment you get from buying an asset
-
Relative return, the return of an asset compared to another asset’s return
Why does relative return help us out? It allows us to make comparisons across market cycles and shows us where the value is in times like these.
To measure it, we’re going to compare stock sectors with the S&P 500 at large. For example, if the S&P 500 returns 10% and the tech sector returns 25%, then the tech sector gave us a 25% absolute return and a 15% relative return. It outperformed the S&P.
In this segment of the market cycle, which sectors tend to outperform the broader market? Those with less cyclical business models.
It makes sense. If we’re at a downtrend in a business cycle, the stocks that most adhere to business cycles aren’t going to do well. The sectors less correlated with these cycles? Well, now may be the time to own them.
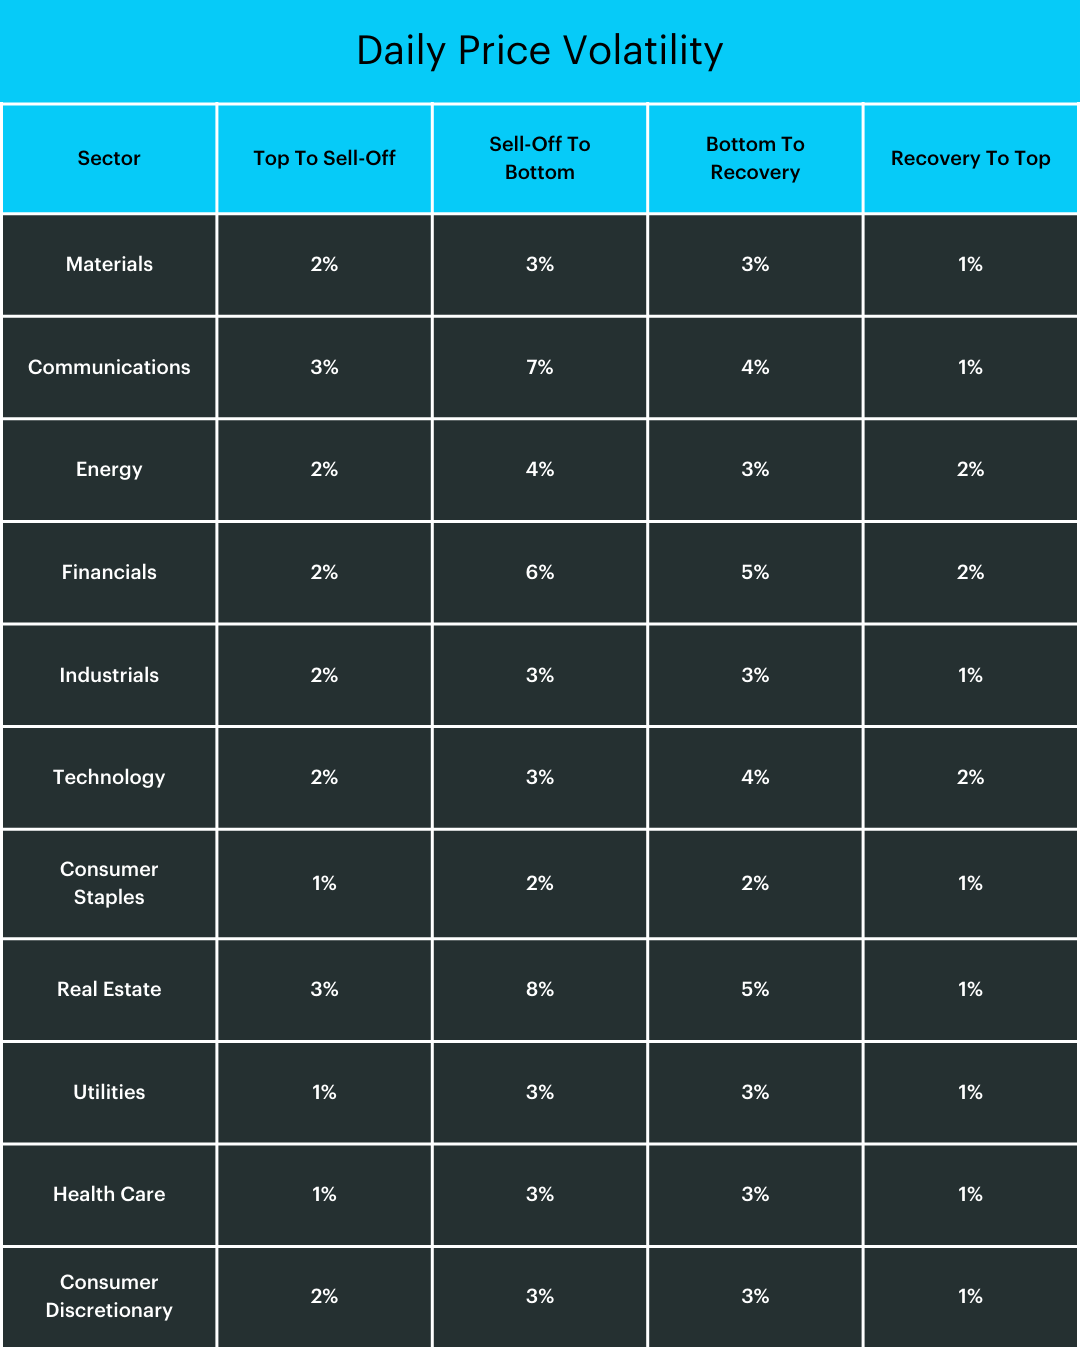
We’re going to throw a lot of data your way, so a few comments first. To start, you’ll notice that communications look like they’re doing great. But keep in mind that the communications sector has only been tracked over the last market cycle, since the pandemic crash of March 2020. The sample size there is limited.
Another note? Technology, or “tech” if you’re short on time. Tech does relatively well, but keep in mind that technology typically doesn’t offer dividends, which aren’t counted here. Basic Materials, Financials, and Utilities tend to offer dividends, which would bump them up on relative terms.
Remember that these are averages, not all stocks in these sectors will lose money over this period. But if we look for investment opportunities in the sectors with the best relative performance, we can still make money in a sell-off/bear market with proper stock selection.

Review that table and you realize why so many people advocate consumer staples in times like these.
Some Additional Context for Market Cycles:
This is all easy to understand in retrospect. But what about when you’re living through a market cycle? What does it actually feel like to watch stocks go up or down, day after day?
First, let’s get a sense of how long they last. Below, we’ll address the expected number of days in each quadrant—and the maximum they’ve ever lasted.


What’s it mean? It’s been about 140 days in our current drawdown, given a market cycle top on January 3, 2022.
That puts us at about 3/4ths of the way to the expected 201 days it takes to get to the first 20% down. But since we’re already almost at 20% from the top, it’s fair to say we may not go through those additional days until we’re there. We might go below the median this time around.
If and when we do hit that 20% drawdown mark, history shows us to expect about another month and a half, more or less, until we reach the market bottom. But again, this is just the expectation. It once took 310 days to get there. And for all we know, it may bounce back up the next day.
It’s a bit like predicting the weather, isn’t it? Fortunately, there are still ways to know whether or not you should bring an umbrella.
Market Cycles in Terms of Volatility:
Volatility is scary. It’s the stuff of haunted house rides and roller coasters.
But when you look at a roller coaster from afar, it’s not quite so scary, is it? Let’s do the same for market cycles and our current volatility.
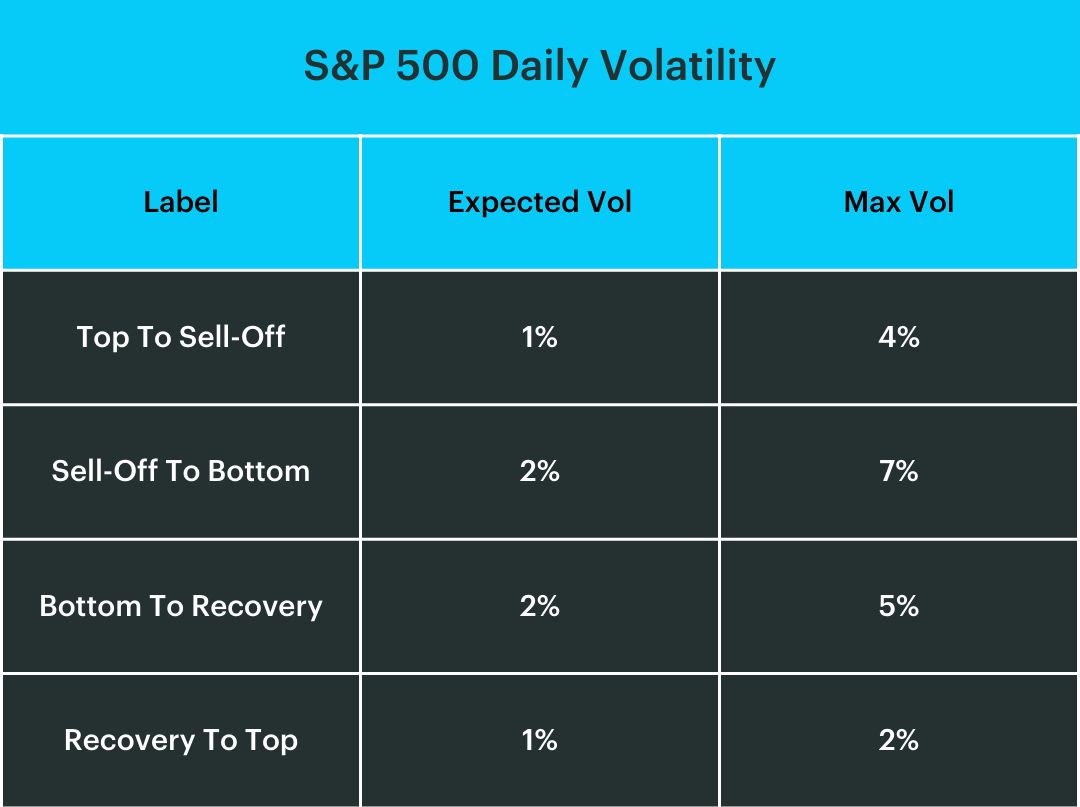
To do that, let’s look at historical market cycles and weigh their volatility, similar to how we measured historical cycles above. Keep in mind we’re still currently in the initial sell-off phase after a recent market top.
To clarify, volatility here is how much we expect prices to change as a percent from day to day. Volatility is an absolute number, meaning a change of 5% down is the same as 5% up. The volatility gives us an idea of how bumpy the ride is, rather than the direction we're going.
Our current volatility since January? 1.53%.
Compared to other Top to Sell-Off periods, that’s a little above normal, but still far from the max.
Let’s go back to roller coasters for a minute. As you’re going down the big drop of a roller coaster, the volatility gets higher towards the end—that’s when the roller coaster starts bending again. The same is true in markets. Volatility will go up in the recovery phase as we bounce back up.
Volatility can be spooky, but there’s no escaping it in investing. Fortunately, if we know what’s coming next, we’re better equipped to keep our cool. We know we can expect higher volatility during this next phase.
Let’s break down volatility by market segment to see what it looks like:
Volatility picks up once we’re past 20% and flying towards the bottom.
Spooky? Maybe. But if you know it’s coming, it’s not quite such a scare.
Here are our conclusions:
-
A difference of 1% when assessing daily price volatility is actually…for lack of a better word…huge. After all, markets don’t drop 20% in a day. 1% movement can make headlines in one day.
-
What performed best during the sell-off period and through the march to the bottom? Consumer Staples, Utilities, and Health Care. On the way back up there's other sectors that perform better (more on this to come).
-
Real Estate and Communications may look crazy-volatile. But since their lifespan as sectors is short relative to the others, the sample size is a bit small.
Where’s the Light at the End of the Tunnel?
Long story short, there is going to be some pain. But it’s when you expect the pain that you’re able to grin and bear it.
But it’s even better if you know where to go from here.
It’s not enough to have a map that says “YOU ARE HERE.” You also have to know where you’re going.
And that’s where we come in.
We’ve done the research for you. We watch the market cycles, we watch the peak-to-trough possibilities, and we break things down by sector.
We then scan those sectors for unique buying opportunities: over-sold companies with a lot of potential for upside when the trough starts heading back towards a peak.
It is, at its most basic, the “buy low, sell high” strategy. The key difference? We actually have some clue when a stock is low.
Want to jump on board?
Want to check the major stock indexes without feeling a sense of dread? Or that twinge of nervousness that comes from having no idea where it might go from one day to the next?
We have the precise stock picks that don’t just tell you where we are in the markets—they tell you where to go.
