How To Invest With Market Sentiment
Jul 05, 2022Welcome to Moby's Analyst Sentiment Dashboard!
We're really excited to roll out this proprietary tool which lets you see how professional analysts on Wall Street view your favorite stock.
This interactive dashboard lets you make the choice to leverage the insight from all of Wall Street or take a contrarian stance and be a renegade.
Either way, this tool allows you to see how the investing world views any stock over time.
And that's why this tool is extremely powerful. Because seeing sentiment, often can dictate how the stock will perform going forward. If sentiment is high, there's a good chance that the stock will outperform and vice versa.
But tools like this don't really exist.
If you want to see analyst ratings or sentiment for a given stock, it's often hard to triangulate.
That's why we built this tool for you. In order to give you another way to help you outperform the market!
To get started just click the drop-down menu and select from any stock in the S&P 500. If you want to learn more about this tool, just check out the description below.
Overview:
So how the heck does this tool work? Well, basically we compiled thousands of analyst recommendations into a set of proprietary indicators, which tell us what percentage of professional analysts are positive, negative, or neutral on a stock.
-
Positive: percent of analysts who believe the company will do well in the near future
-
Neutral: percent of analysts who believe it's a good company, but nothing special
-
Negative: percent of analysts who believe the company will have some trouble in the near future
What does it mean?
Wall Street analysts will take a stance on a stock when earnings are reported or significant news comes out that may materially affect the future of a company.
The way they communicate their opinion generally comes in the form of a recommendation: “buy”, “sell”, or “hold”.
Sometimes they use even more steps, like “strong-buy”, “weak buy”, “strong sell”, and “weak sell”. Sometimes they abandon this structure altogether and they state their stance as “Market Buy” or “Sector Underweight”.
This makes it very difficult to compare one analyst’s recommendations to another.
Moby's Analyst Sentiment Dashboard compiles these random recommendations into a set of unified stock sentiment indicators.
So, at any point in time, we can see what percentage of analysts have a positive, negative, and neutral view on any stock in the S&P 500.
More importantly, we can see the directional movement of the sentiment!
How does it work?
We bucket the many ways analysts communicate sentiment into simple “Positive”, “Neutral”, and “Negative” categories. It is in the nature of these recommendations to be updated quarterly, semi-annually, or annually based on the release of financial statements.
However, recommendations over a year old are generally outdated. To keep our information current, we remove any recommendations over 12 months old.
Although few events throughout the year prompt an update to an analyst’s view on a stock, recommendations can be made at any point throughout the year.
Some analysts might not make a recommendation until late May on a stock that reported earnings in mid-February. On one hand, that analyst’s recommendation is a little late, as the stock has already moved on those reported earnings; however, that analyst now has more information on the stock and the market than they would have at the time of the earnings report.
We want to account for the fact that more recent analyst recommendations benefit from more relevant information. To accomplish this, we smooth the sentiment using an Exponential Moving Average from the last 12 months.
Exponential moving average:
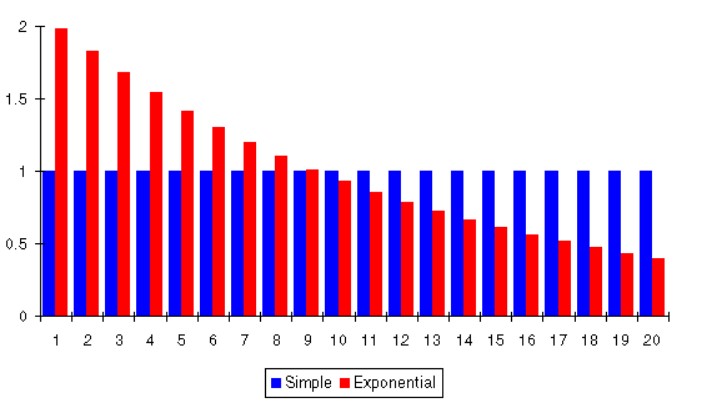
An Exponential Moving Average gives exponentially less weight to each observation.
As shown in the chart below for a 20-day look-back period, the difference between an Exponential Moving Average and a Simple Moving Average is the weight we give each observation in our look-back period.
With a simple average, we think of each observation as being equally important, and with an Exponential Moving Average, we think of the more recent observations as being more important than the older observations in our look-back period.
Long story short we're using the most recent data always to help inform you what the true sentiment is!